Historically, traffic graphs on Cloudflare Radar have displayed two metrics: total traffic and HTTP traffic. These graphs show normalized traffic volumes measured in bytes, derived from aggregated NetFlow data. (NetFlow is a protocol used to collect metadata about IP traffic flows traversing network devices.) Today, we’re adding another metric that reflects the number of HTTP requests, normalized over the same time period. By comparing bytes with requests, readers can gain additional insights into traffic patterns and user behavior. Below, we review how this new data has been incorporated into Radar, and explore HTTP request traffic in more detail.
Note that while we refer to “HTTP request traffic” in this post and on Radar, the term encompasses requests made in the clear over HTTP and over encrypted connections using HTTPS – the latter accounts for ~95% of all requests to Cloudflare during July 2024.
New and updated graphs
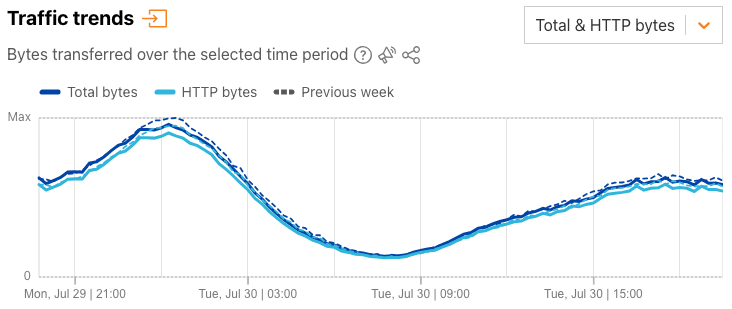
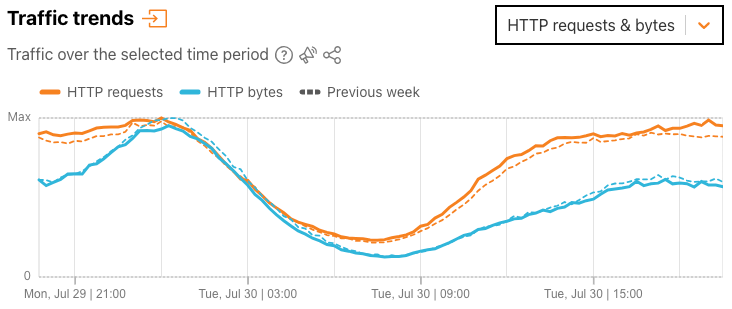
Graphs including HTTP request-based traffic data have been added to the Overview and Traffic sections on Cloudflare Radar. On the Overview page, the “Traffic trends” graph now includes a drop-down selector at the upper right, where you can choose between “Total & HTTP bytes” and “HTTP requests & bytes”. We explore the distinction between these further in the following sections.

The default “Total & HTTP bytes” selection displays a time series graph, showing total bytes and HTTP bytes traffic over time, as Radar has done for several years now.

Selecting “HTTP requests & bytes” from the dropdown switches the view to a time series graph that HTTP requests traffic and HTTP bytes traffic over time. In both graphs, users can click on a metric in the legend to deselect it and remove it from the graph. These (de)selections are maintained when a user chooses to download or save a graph.

In addition, we’ve added a “Protocols” summary next to the graph that shows the share of bytes over the selected time period that HTTP accounts for, and the remaining aggregate share associated with the protocols used by other non-HTTP Cloudflare services (such as DNS, WARP, etc.). For most locations or ASNs, HTTP traffic will comprise the majority share of bytes-based traffic.

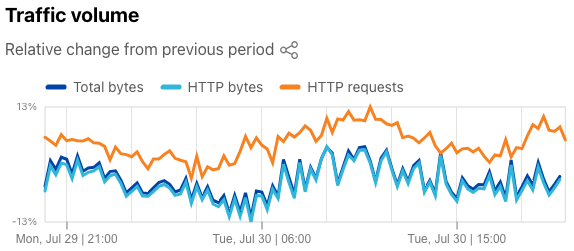
On Radar’s Traffic page, we have added the HTTP requests metric to the “Traffic volume” graph at the top of the page, allowing you to see how request volume has changed during the selected time period as compared to the previous period, in addition to the changes in the bytes-based metrics.

A new standalone request-based “HTTP traffic” graph was also added to the Traffic page, just below the bytes-based “Traffic trends” graph. This new graph shows normalized HTTP request traffic volume across the selected time period, and by default, also compares it with the previous time period.

Similar to other Radar graphs, these new HTTP request-based graphs can also be downloaded, copied to the clipboard, or embedded in other websites – just click on the share icon.
As always, the underlying data is also available through the Radar API. The “HTTP requests Time Series” API endpoint returns normalized HTTP request time series data across the specified time period for the requested location or autonomous system (ASN).
What is HTTP request traffic?
An HTTP GET request is a message sent from a client (such as your web browser) to a web server (such as one operated by Cloudflare), asking for a particular resource (file). In addition to returning the requested resource, which could range from a single-pixel GIF accounting for just a few bytes, to an API call that returns a few kilobytes of data, to a multi-gigabyte software package, the Web server also returns a set of headers, which can include information about the content type, the last time the resource was modified, cookie information, cacheability, and more. While GET requests account for the overwhelming majority of HTTP request traffic, such traffic also includes other HTTP request methods including HEAD, POST, PUT, and more.
Cloudflare temporarily logs HTTP requests received by our network, including associated header information and “metadata” about the request, such as the bot score computed for the request and the associated cache status. Request logs for a customer’s web properties are available for them to download, and after processing and analysis, this data is also presented in the Analytics section of the Cloudflare dashboard. The HTTP request data now available on Radar is based on a sample of this log data, aggregated across Cloudflare’s global customer base.
The value of request-based traffic insights
Cloudflare Radar already has HTTP data, so why add more? One key reason for analyzing and including HTTP request traffic is resilience. Having multiple sources of truth with respect to HTTP traffic allows us to better and more quickly distinguish between real events (such as an Internet disruption in a given country or network) and data pipeline issues.
While bytes-based metrics provide a reasonable proxy into human (user) behavior, especially with respect to activity surrounding Internet disruptions, request-based metrics provide an even better perspective. A lot of HTTP traffic involves relatively small responses – especially API traffic, which now accounts for 60% of all traffic. Furthermore, response sizes can vary widely, ranging from a single-pixel GIF accounting for just a few bytes, to an API call that returns a few kilobytes of data, to a multi-gigabyte software package
To that end, the scope of user activity may be insufficiently reflected by a bytes-based metric, or buried in the noise, whereas request activity provides a cleaner signal and a more direct proxy for user activity. This is especially important as we examine the restoration of connectivity after an Internet disruption, attempting to ascertain when activity has returned to “expected” pre-disruption levels.
Finally, incorporating request-based traffic insights into Radar is simply extending the way that the data is already being used on the site. All the graphs, maps, and tables presented on Radar’s Adoption & Usage page, are based on analysis of HTTP request traffic, making use of information contained within request headers (such as HTTP version or user agent) or characteristics of the underlying connection (such as IP version).
Bytes vs requests – what’s the difference?
The current “HTTP traffic” view aggregates the bytes associated with HTTP requests to Cloudflare’s content delivery (CDN) services from the selected location or autonomous system (ASN). “Total traffic” aggregates this HTTP traffic along with the traffic associated with other Cloudflare services, including our 1.1.1.1 DNS resolver, authoritative DNS, WARP, and Spectrum, among others. (While Spectrum, WARP, and 1.1.1.1 also carry HTTP traffic, the share of HTTP traffic carried by these services is opaque to Radar, and isn’t accounted for as part of the HTTP traffic calculations.)
The bytes associated with a given request include the size of the request, the size of the headers associated with the response, and the size of the response itself. As noted above, the size of a file returned in response to a request can vary widely, depending on what was requested. The shape of the HTTP requests and HTTP bytes lines may be quite similar, but the potential variability in response sizes (in aggregate) can cause the lines to diverge, sometimes significantly so. For example, if an application regularly makes background requests to check for updates, the availability and subsequent download of a large file containing a software update would cause a spike in the HTTP bytes line, while the HTTP requests pattern remained consistent.
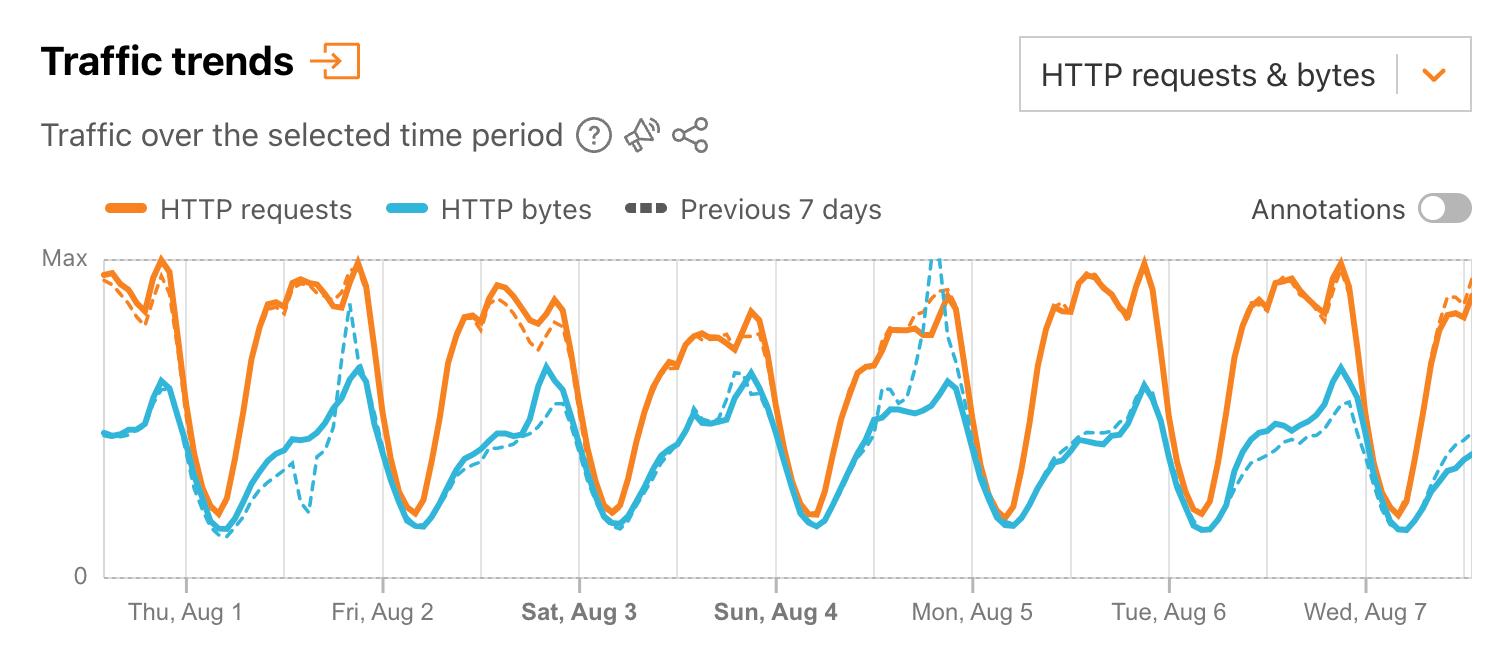
As another example, consider the graph below, capturing HTTP requests and bytes traffic trends for Portugal during the first week of August. HTTP bytes traffic initially grows each day between 06:00 and 09:00 UTC (07:00 – 10:00 local summer time), increases much more slowly until around 19:00 UTC (20:00 local summer time), and then increases rapidly before peaking around 21:00 UTC (22:00 local time). This suggests that content consumed during the workday is lighter in terms of bytes (such as API traffic, as discussed above), while evening traffic is more byte-heavy (possibly due to increased consumption of media content). In contrast, after starting to increase around 06:00 UTC (07:00 local summer time), request traffic generally sees three successively higher peaks each day – occurring around 10:00, 14:00, and 21:00 UTC respectively (11:00, 15:00, and 22:00 local summer time). These peaks are most pronounced on weekdays, but are still apparent on weekend days as well, suggesting regular patterns of user activity at those times.

It is important to remember that in looking at the “HTTP requests & bytes” graphs on Radar that they are showing two different metrics, and as such, only their shape over time is comparable, not their relative sizes. (As both metrics are normalized on a 0 to 1 (Max) scale, the lines on the graph are scaled relative to the maximum normalized value of each metric, including the previous period.)
Conclusion
The addition of HTTP request metrics to Cloudflare Radar brings additional visibility to traffic trends at a global, location, and network level, complementing the existing bytes-based HTTP traffic metrics. Derived from traffic to customer web properties, these new metrics can be found on Radar’s Overview and Traffic pages.
In addition to HTTP traffic trends, visit Cloudflare Radar for additional insights around Internet disruptions, routing issues, attacks, domain popularity, and Internet quality. Follow us on social media at @CloudflareRadar (X), noc.social/@cloudflareradar (Mastodon), and radar.cloudflare.com (Bluesky), or contact us via email.
Source:: CloudFlare
