Within the Kraken platform, we host a Dispatch API responsible for reading and writing dispatches on assets. A dispatch is an import or export of power, whilst an asset can take many different forms: ranging from commercial-scale batteries to electric vehicles. In recent months, the number of dispatch requests processed by the API has significantly increased. We expect this trend to persist as more assets integrate onto the platform. Over time, without taking action, continued increases would lead to performance degradation under the API’s current architecture.
With that in mind, the Control & Dispatch team developed a new API – the Power API – which is designed to read and write power data, including dispatches, for a greater number of assets whilst delivering performance improvements per request. The team’s worked hard on the development of Power API, which will soon replace Dispatch API within the platform.
Kraken’s APIs are hosted in the cloud using Amazon Web Services (AWS). The Control & Dispatch team own the Dispatch and Power APIs, following a philosophy of adopting AWS serverless technology where this benefits business needs. The Power API leverages Amazon API Gateway with serverless Lambda functions to process read and write requests. New or updated power data is saved in a NoSQL DynamoDB table with changes to data captured in a DynamoDB Stream.

Several internal services were already subscribed to dispatch update events broadcast by the Dispatch API. Therefore, we required Power API to emit equivalent events before we could migrate these services away from Dispatch API. We adopted Amazon EventBridge to fulfil this requirement using an Event Bus, which acts as a broker between
- Power API
- services that need to process power changes
So how are power changes sent to the Event Bus from the DynamoDB Stream?
Introducing EventBridge Pipes
The team is leveraging EventBridge Pipes to address this problem. Pipes ease the integration process between AWS resources — reducing the need for Lambda functions hosting custom application code – which includes integrations between DynamoDB Streams and EventBridge Event Buses.

At a high level, Pipes consist of four stages:
For Power API, the source integration is the DynamoDB Stream, and the target is the Event Bus. Filtering is configurable to specify which Stream records to put onto the Event Bus. While the Stream captures DynamoDB record inserts, updates, and deletions, we filter out deletions at this stage. We also skip the enhancement stage, which would require us to add additional infrastructure and / or custom logic within Lambda functions. The raw data from the Stream suffices for our needs.

By default, we provision the infrastructure as code using the AWS Serverless Application Model (SAM) framework. Pipes are configurable under this framework using JSON or YAML syntax, where all Pipe stages can be defined to easily integrate the Stream to the Event Bus. Below is a simplified snippet of how the Power API’s Pipe is configured using SAM.
EventPublisherPipeExecutionFailureAlarm:
  Type: AWS::CloudWatch::Alarm
  Properties:
    AlarmActions:
      - !Ref AlertSnsTopic
    OKActions:
      - !Ref AlertSnsTopic
    AlarmName: !Sub '${AWS::StackName}-EventPublisherPipeExecutionFailure'
    ComparisonOperator: GreaterThanThreshold
    Dimensions:
      - Name: PipeName
        Value: !Ref EventPublisherPipe
    EvaluationPeriods: 15
    MetricName: ExecutionFailed
    Namespace: AWS/EventBridge/Pipes
    Period: 60 # seconds
    Statistic: Sum
    Threshold: 0
    TreatMissingData: notBreaching
Note that other resources are omitted from the snippet. For example, the DynamoDB table PowersTable and the Event Bus EventPublisherEventBus. Furthermore, it is possible to transform input data for the target and enhancement steps. In the case of Power API, Stream record data nested within dynamodb → NewImage is extracted to simplify what the Event Bus receives.
When leveraging Pipes, further consideration is required for error scenarios. A few questions emerge:
- What happens if the Pipe fails to put records onto the Event Bus?
- How long do we have to remediate problems when they arise?
- How are we made aware of Pipe errors when they occur?
Error handling With Pipes
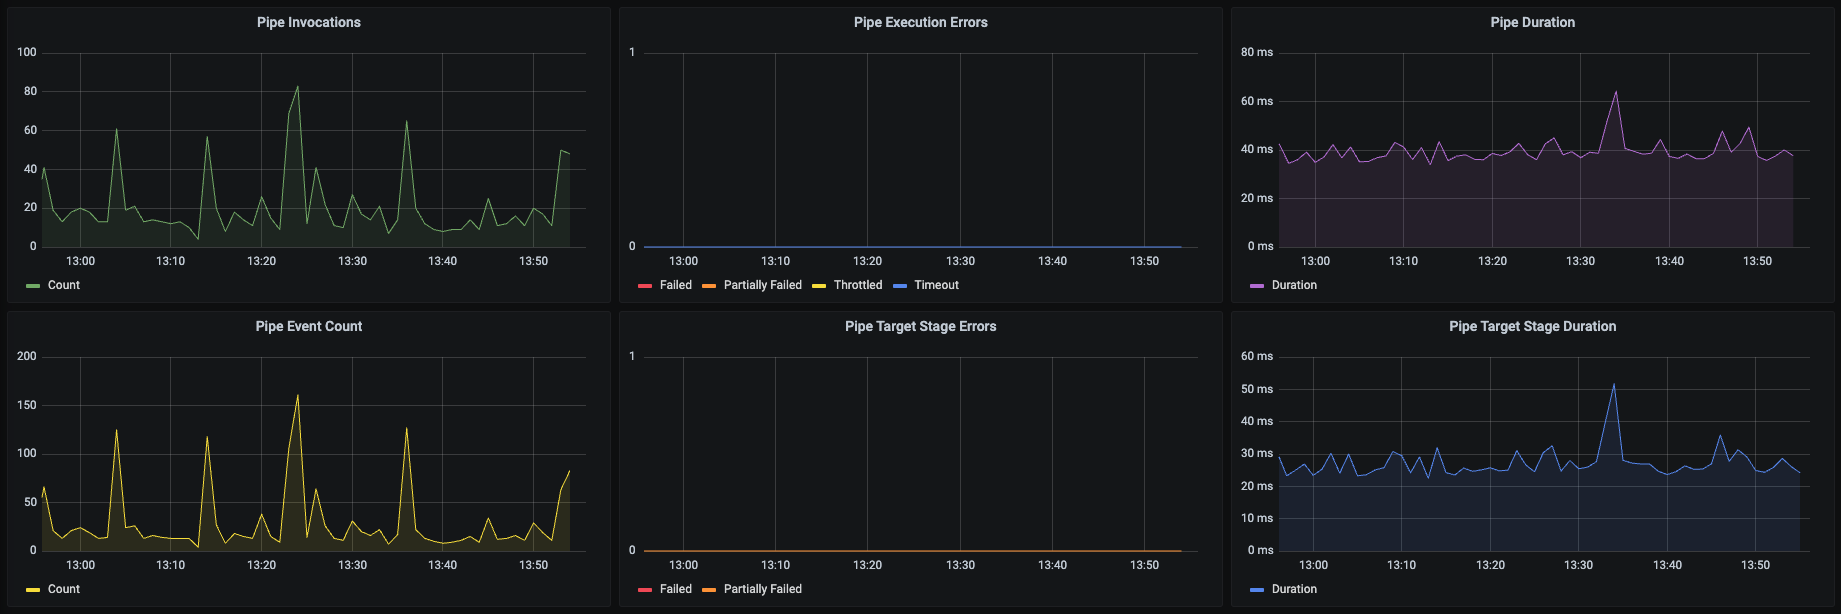
We observe application behavior through CloudWatch Metrics with Grafana dashboards. Pipes offer a range of metrics to monitor invocations, processing durations, and execution errors. We also contributed to Grafana in the past to make it easier to add Pipe metrics to these dashboards. Below is a screenshot of our Pipe dashboard panels.

Note that the “Pipe Execution Errors” panel covers a few scenarios — namely timeouts, throttling, and explicit failures processing a record. The “Pipe Target Stage Errors” focuses specifically on the target Event Bus and highlights any errors that arise for that particular stage of the Pipe. Throttling measures when a Pipe is invoked too many times within a short interval.
All of these scenarios are automatically retried by EventBridge Pipes. If errors surface from the target Event Bus, retry back-off is applied. The Pipe retries errors until the record expires at source. The only exception occurs when errors like insufficient permissions arise continuously, in which case the Pipe may disable itself, but we haven’t observed this behavior during testing.
DynamoDB Stream records are retained for 24 hours. Therefore, we have 24 hours to remediate problems in our Pipe configuration. We could retain records for longer by attaching a dead letter queue (DLQ) to the Pipe. However, records sent to the DLQ only contain metadata about Stream records – specifically, a reference pointer to where exactly records reside in the Stream. After 24 hours, this metadata points to records deleted from the stream, so a DLQ does not increase how much time we have to resolve Pipe errors before losing power changes.
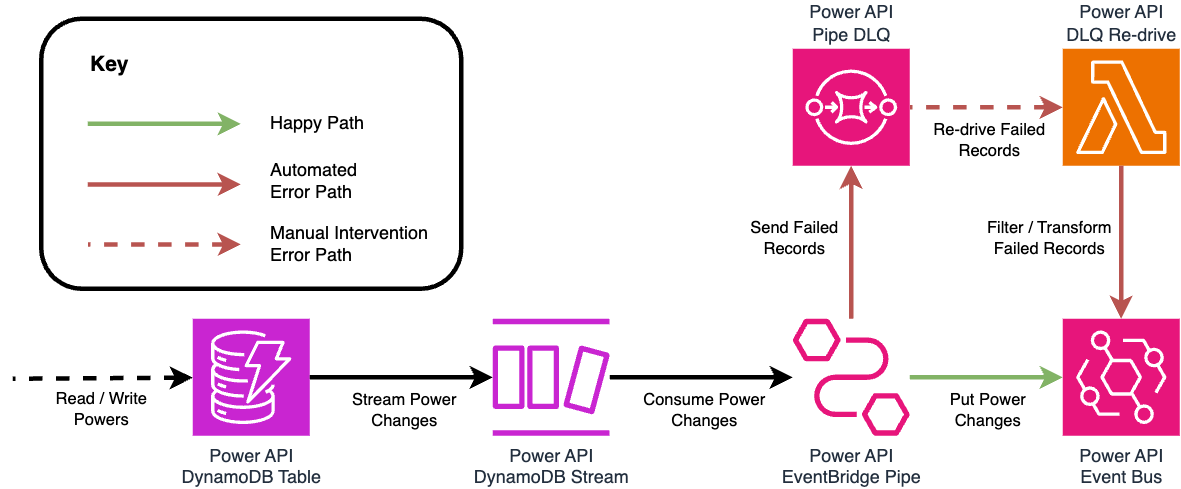
Even if we were to address that particular issue, there is no AWS managed re-drive mechanism at the time of writing to move Stream records from the DLQ back to the Pipe. There’s also no API or SDK available to trigger the Pipe with a record. There are a couple approaches we considered to work around these limitations. One option requires custom logic within a Lambda function to read from the DLQ, replicate the Pipe’s filtering and transformation logic, then send records directly to the Event Bus. This is considerable overhead for us to manage, which itself could be error-prone. Below is an architecture diagram showing how such a re-drive solution may look.

Another solution would be to create a secondary Pipe using the SQS DLQ as its source and targeting the same Event Bus. However, if we encounter problems with our original Pipe, it’s possible that a secondary Pipe would yield similar issues to resolve.
Considering further what error scenarios we expect to observe, only two likely cases arise:
- The Pipe has insufficient permissions to put records onto the Event Bus.
- An internal error arises within AWS.
Regarding permissions, we only expect to observe such problems during working hours when we actively develop changes. During this time we can act swiftly to rectify permissions comfortably within 24 hours. In the case of internal errors, there’s a reliance on AWS to provide high availability and reliability — internal issues are extremely unlikely to persist for more than 24 hours. Internal issues can also apply to DLQs and re-drive mechanisms, so this particular problem is not eliminated with the addition of re-drive infrastructure.
For both scenarios, the likelihood of resolving problems in 24 hours is exceptionally high, especially with support from AWS and internally at Kraken. Therefore we accept the risk posed in not attaching a DLQ to the Pipe for now. Of course, this is subject to review if circumstances change, or if AWS launches an improved re-drive experience for Pipes.
In any event, if a problem arises, we need to be notified as soon as possible in order to act and resolve the root cause. CloudWatch Alarms are configured on several Pipe metrics to make sure issues are brought to our attention promptly: specifically on ExecutionFailed, ExecutionThrottled, and ExecutionTimeout.
Below is a SAM template snippet for the ExecutionFailed alarm. Keeping in mind that failed executions are automatically retried, this alarm is set to raise only if failures persist for more than 15 minutes. This is achieved by setting an evaluation Period of one minute, and specifying that 15 consecutive EvalutionPeriods must observe a failed execution. We have other alarms configured to alert us when the Pipe automatically disables itself.
EventPublisherPipeExecutionFailureAlarm:
    Type: AWS::CloudWatch::Alarm
    Properties:
      AlarmActions:
        - !Ref AlertSnsTopic
      OKActions:
        - !Ref AlertSnsTopic
      AlarmName: !Sub '${AWS::StackName}-EventPublisherPipeExecutionFailure'
      ComparisonOperator: GreaterThanThreshold
      Dimensions:
        - Name: PipeName
          Value: !Ref EventPublisherPipe
      EvaluationPeriods: 15
      MetricName: ExecutionFailed
      Namespace: AWS/EventBridge/Pipes
      Period: 60 # seconds
      Statistic: Sum
      Threshold: 0
      TreatMissingData: notBreaching
Conclusion
We’re satisfied Pipes are a great resource to forward DynamoDB Stream records to an EventBridge Event Bus. Whilst the lack of a fully managed DLQ re-drive mechanism is disappointing, it’s not a deal breaker for us in our particular use case. Going forward, we will monitor AWS feature releases and review how Pipe usage may be improved. The recent launch of EventBridge Pipe logging support is a welcome addition.
Work on the Power API remains in progress at the time of writing. We plan to complete our migration from Dispatch API to Power API in Q2 2024, although this is subject to change. In the meantime, stay tuned for further updates from us regarding how we develop software and leverage AWS services.
Source:: Kraken Technologies